It rains pretty regularly, in the shell
By Bob Mesibov, published 14/09/2017 in Tutorials
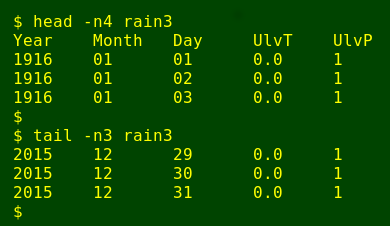
In a 2-article series here on The Linux Rain last May (part 1 and part2) I described how I used AWK to clean up rainfall data for my home town in Tasmania. The result was a file called rain3 with rainfall totals for each of the 36525 days from 1 January 1916 to 31 December 2015:
In this article I look at a couple of ways the daily rainfall varied over time, with results that might surprise you.
The big one
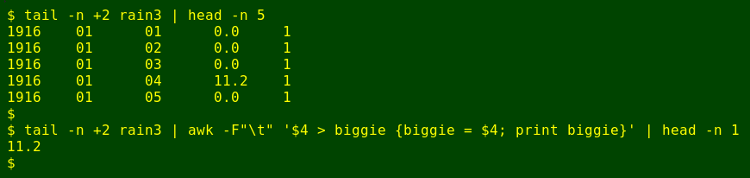
The first question I need to answer is What was the biggest 1-day fall? As usual I'll call on AWK to tell me:

The tail command feeds everything but the rain3 header line to AWK, which stores the rainfall total (in field 4) in the variable "biggie" as it goes through rain3 line by line. If the current line's total is larger than what's been stored ($4 > biggie), the variable is re-set to the current line's total (biggie = $4). After all the lines have been processed (END section), the variable gets printed.
Note that I haven't initialised the variable "biggie". That's done automatically by AWK, as shown here:
If I hadn't excluded the header line with tail, AWK would have decided that the header line entry in field 4, "UlvT", had the biggest value of all. That's because AWK needs to be told if "bigger" refers to a string or a number. When sorting numbers and letters together, the letter "U" comes after (is bigger than) any number.
How about just initialising the variable "biggie" as zero?:

Nope. So, like it says in the GNU AWK manual, To force a string to be converted to a number, add zero to that string. The simple trick of adding zero to "UlvT" in the first line (NR == 1) "sets" AWK to recognise all field 4 entries as numbers.

OK, so there was a maximum 1-day fall of 150.6 mm. I'll use that in what follows.
Threshold rainfall frequencies
Meteorologists have sophisticated ways of analysing how rainfall varies over time, because they get asked questions like How much rain would fall in a 1-in-100-year storm? They're also less interested in daily rainfall totals than in totals-per-event (over several days) and in rainfall intensity, usually in millimetres per hour.
I'll use a simpler method, namely asking On how many days in the 100-year study period was the rainfall total equal to or greater than X mm?
tail -n +2 rain3 | awk 'BEGIN {print "Min_mm\tNo_days"} \
{for (i=0;i<=150;i+=5) if ($4 >= i) s[i]++} \
END {for (a in s) {print a"\t"s[a]}}'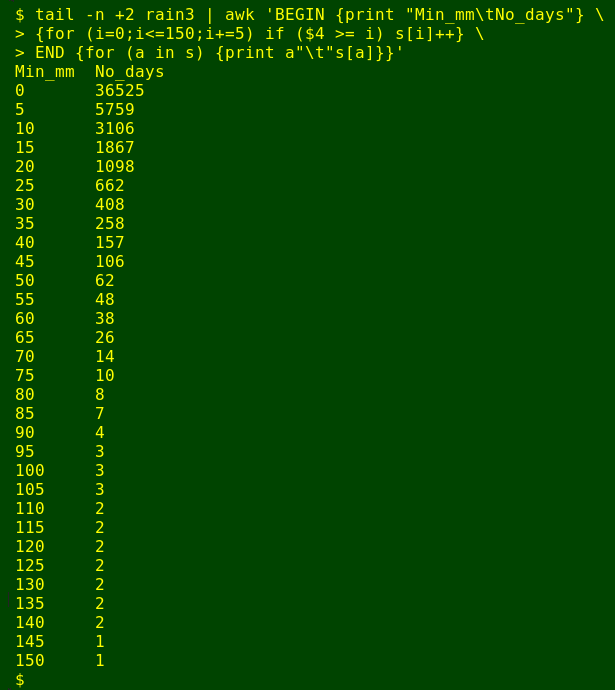
In this command AWK first prints a couple of column headers: "Min_mm" for the minimum rainfall and "No_days" for the number of days with that minimum rainfall. Next I use a for loop that starts the variable "i" at zero (mm), finishes it at or less than 150 (mm), and increments it by 5 (mm). For every "i" thus defined, AWK checks to see if field 4's value is greater than or equal to "i". If it is, AWK adds a count of 1 to an array "s" with index "i". After going line by line through the 36525 totals, AWK goes through the arrays and for each one prints the index value, a tab character, and the count of days.
...and the result is...
Plotting the output table from AWK in Gnumeric spreadsheet I get this graph when using a logarithmic y axis:
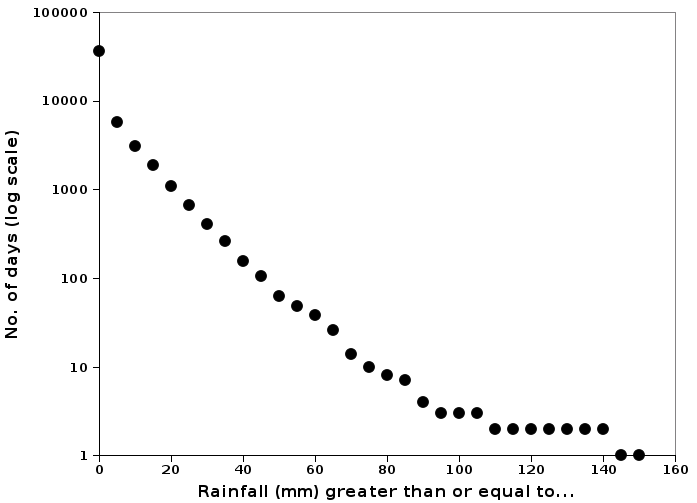
Surprised at how regular the pattern is? That nearly straight line gets noisy at the high-rainfall end of the data, where there are so few days. If you mentally extrapolate the plot to the x axis, which is the 1-day line, it looks like the highest 1-day total might have been about 110 mm, but in fact it was over 150 mm. When was that?
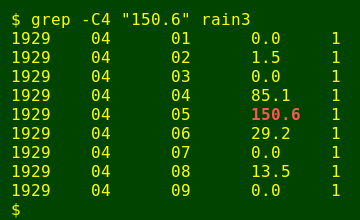
In the first week of April 1929 the town got 265 mm of rain over a 3-day period, resulting in what older locals still remember as "the great floods". In my part of the world, that was a colossal rain event.
How about tomorrow's weather?
Another question I can ask using rain3 concerns transitions from day to day. If it's rainy today, what are the chances that it will be rainy tomorrow, or in other words, what are the chances of a "rain-to-rain" transition? And how about "rain-to-fine", and so on?
I'll use AWK again, but to show how the command works I'll operate on a simple file with 10 fine (F) and rain (R) items in a list, and 9 transitions:
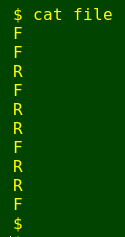
To get AWK to go through the file I'll use the trick of converting each record into a separate field, then loop through the fields checking each field against its predecessor. For the record-to-field conversion I can use a paste command:
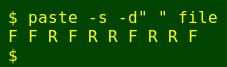
And the looping goes like this:
awk '{for (i=2;i<=10;i++) \
if ($i=="F" && $(i-1)=="F") FF++; \
else if ($i=="F" && $(i-1)=="R") FR++; \
else if ($i=="R" && $(i-1)=="F") RF++; \
else RR++} \
END {print "fine > fine = "FF"\nfine > rain = "FR"\nrain > fine = "RF"\nrain > rain = "RR}'
For each of the 9 fields starting with field 2, AWK checks the "F" or "R" value and increments an appropriate variable. For example, if the field has "F" and the preceding field has "F", the "FF" variable is incremented. At the end, prints out the 4 variables after a text "explainer":
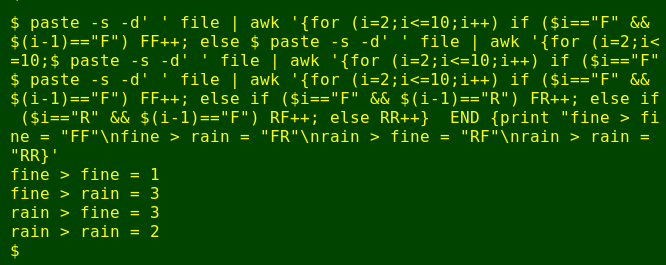
It's a big and ugly command but it quickly generates the right answer, namely that in my demo file there's 1 fine-to-fine transition, 3 fine-to-rain transitions, and so on.
The 100-year pattern
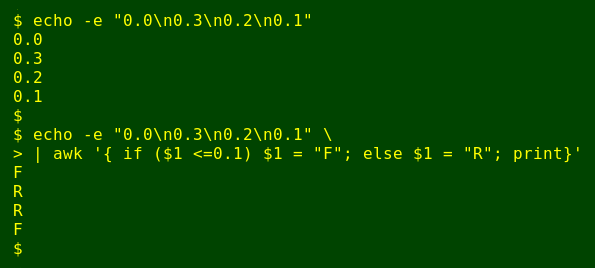
Back to rain3, or rather the 4th field minus its header line, which is a list of 36525 daily rainfall totals. How do I convert that list of numbers to "F" and "R" values before feeding it to paste and AWK?
The answer's not simple because the definition of "F" and "R" isn't simple. What's a rainy day? In Australia, the Bureau of Meteorology says a rainy day has at least 0.2 mm total, but at some rainfall stations 0.1 mm, and a rainfall total of 0.2 mm is quite a small amount of rain, and unlikely to have much impact on many activities. Therefore, days of rain greater than or equal to 1 mm, 10 mm, and 25 mm are often used as indicators of the number of "wet" days.
OK, I'll go with that 0.2 mm figure for "R", like this:
Having converted the 36525 falls to "F" and "R", I can feed that list to paste and the big AWK command:
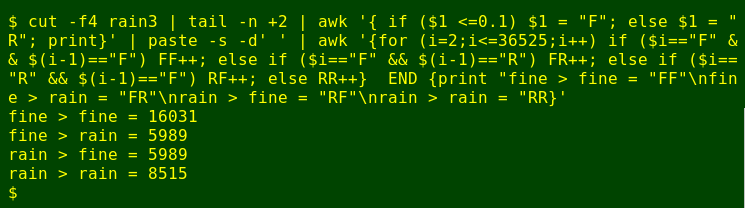
There are the answers, but it's just coincidence that the numbers of days with rain-to-fine and fine-to-rain transitions are exactly the same — those figures will vary with the definition of a rainy day.
So, in the 100 years 1916 through 2015, a fine day in my town was followed by a fine day 16031/(16031+5989) or 73% of the time, and a rainy day was followed by a rainy day 8515/(58515+5989) or 59% of the time.
Overall, tomorrow's weather ("fine" = rainfall total 0.0 or 0.1 mm, "rain" otherwise), was (16031+8515)/36524, or 67% likely to be the same as today's, or 2 chances out of 3. I'll remember that as a rule of thumb, since I'll probably forget the 73% and 59%!