AWK and a rainfall time series - Part 2
By Bob Mesibov, published 16/05/2017 in Tutorials
In part 1 of this article I showed how I used AWK on the command line to work up daily rainfall data for my home town, Ulverstone in Tasmania. I wasn't ready to analyse the data, because there were quite a few missing-data days. Some were part of accumulated-total series, where the rainfall total for four days (for example) was given on day 4 after three missing-data days, while other missing-data days were isolated.
My plan is to fill in the missing data using adjusted totals from the nearby rainfall stations mentioned in part 1, starting with days missing in accumulation gaps.
Accumulation gaps
For convenience I'll extract the accumulation gaps and their accumulated totals from four_towns and work with them separately. Since the gaps are well-behaved, in the sense that each accumulation total is preceded by exactly one fewer missing-data days than the accumulation period, I can use a shell trick for the extraction:
tac four_towns | awk -F"\t" '$5 > 1 {print; f=1; next} $5 == 1 {f=0} f' | tac > accumsThe tac command inverts the file, putting it in reverse chronological order. The output is sent to AWK, which looks first for a line with an Ulverstone accumulation period greater than 1 (that is, more than one day). When it finds such a line, it prints the line and sets a flag before stopping the processing and moving to the next line. The next line or lines will be the missing-data lines leading up to the accumulation total. These lines are printed because their period fields are blank (neither equal to or greater than 1) and because the last part of the AWK command, "f", tells AWK to print a line if the flag is set. The run of missing-data days will end either with another accumulation run ($5 > 1), in which case the printing will just continue, or with a 1-day period, in which case AWK turns off the flag. The "$5 == 1" line isn't printed because the flag is turned off before the instruction to print if the flag is on.
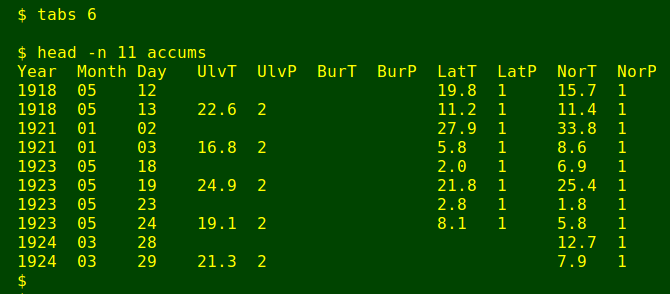
The output is inverted again with tac to put the records in chronological order, and the output sent to the file accums:
Backfilling
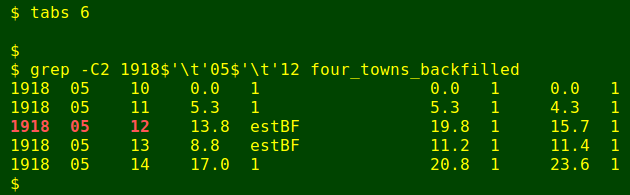
To see how I backfill, look at the first two data lines in accums, as shown in the screenshot above, for 12 and 13 May 1918. The aim is to divide the 22.6 mm recorded at Ulverstone on 13 May into portions for 12 and 13 May according to available 1-day falls at the other stations. In this case there are 1-day falls for both days at Latrobe and Northdown. Since I'm only interested in ratios, not absolute amounts, I don't have to adjust the Latrobe or Northdown numbers, and since data from more than one nearby station are available I can average the results.
The average proportion of the 2-day falls at Latrobe and Northdown on 12 May was (19.8 + 15.7)/(19.8 + 15.7 + 11.2 + 11.4) = 0.61. I therefore estimate the Ulverstone rainfall on 12 May as 0.61 x 22.6 = 13.8 mm, and the 13 May Ulverstone rainfall as 8.8 mm.
It would be possible to code this procedure in AWK for the whole of accums, but I'd have to allow for exceptional and head-scratching cases, and the commands would be large and ugly. I decided instead to do backfilling in Gnumeric spreadsheet, carefully examining each case before using spreadsheet formulas to get the backfilled Ulverstone rainfall. It wasn't a huge job, as there were only 90 backfills to be done, 72 of which were 2-day accumulations:
awk -F"\t" 'NR > 1 && $5 >= 1' accums | wc -l
awk -F"\t" 'NR > 1 && $5 == 2' accums | wc -l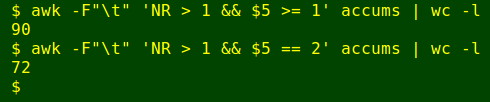
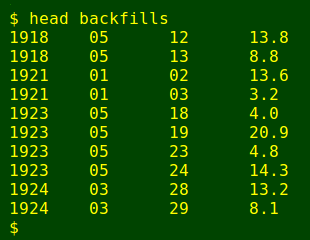
The backfilled result from Gnumeric was saved as the tab-separated text file backfills (compare with first screenshot, above):
Intermission and a disclaimer
I don't always use the command line for data processing. Some jobs, like the eyeballing and manipulating of accums, above, are more easily done in a spreadsheet. But command-line processing has three big advantages. The first is performance. Ulverstone's 100-year daily rainfall data is 36525 lines, but the commands I use would work fast and just as reliably on a file with 36,525,000 lines — a file that would knock a spreadsheet unconscious. The second advantage is in documenting the processing work. It's much easier to record exactly what I did in a data-processing workflow as a command (as I'm doing in this article) than as a report on a series of mouse-clicks in a graphical program like a spreadsheet. The third advantage is capability. I'm not sure I could even do in a spreadsheet all of the tasks demonstrated in this article, at least not without writing a program in the spreadsheet's macro language, and that sounds a lot like command-line work, only harder.
If you use a spreadsheet for data work, please note that tab-separated text files and spreadsheet files are easily interconverted, so you're always just a quick conversion away from the command line.
Add the backfilled results
The results from backfilling now need to be added to four-towns as replacements for the existing Ulverstone total and period on those days. I'll do the replacement with AWK, but to avoid having to deal with a multidimensional array I'll use a trick, and replace the first three fields in backfills and four-towns with a single concatenated date field:
awk 'BEGIN {FS=OFS="\t"} {print $1"-"$2"-"$3,$4}' backfills > BFtrick
awk 'BEGIN {FS=OFS="\t"} {print $1"-"$2"-"$3,$4,$5,$6,$7,$8,$9,$10,$11}' four_towns > FTtrick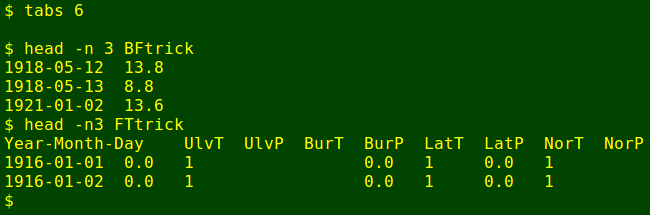
awk 'BEGIN {FS=OFS="\t"} FNR==NR {backfill[$1]=$2; next} $1 in backfill {$2=backfill[$1]; $3="estBF"} 1' BFtrick FTtrick | sed 's/-/\t/g' > four_towns_backfilledThe command above does the replacements. AWK first builds the array "backfill" from BFtrick using the concatenated dates in field 1 as an index, with the value of the array item being the estimated total for each day. It then scans FTtrick and if it finds a match in field 1 for the index values in "backfill", it replaces field 2 with the total from the array and field 3 (period) with the string "estBF". Since the only hyphens in FTtrick are in the concatenated dates, I then "de-concatenate" the dates by replacing every hyphen with a tab, with sed:
Infilling
Now that the accumulation gaps have been backfilled, all the remaining missing total entries are 1-day rainfalls, to be estimated from 1-day total entries at the nearby stations. That's assuming there actually are 1-day falls recorded at one or more of those stations. To check, I use AWK to tally the number of 1-day falls at the other stations on missing-data days for Ulverstone:
awk -F"\t" '$4 == "" {for (i=7;i<=NF;i+=2) if ($i==1) ones++; print ones} {ones=0}' four_towns_backfilled | sort -n | uniq -cFor each line in four_towns_backfilled with the Ulverstone total field blank, AWK checks the period fields 7 (BurP), 9 (LatP) and 11 (NorP). If the period is 1, AWK adds 1 to the counting variable "ones". After the three fields have been checked, the count is printed and the count re-set to zero. The output is sorted numerically and uniqly tallied.
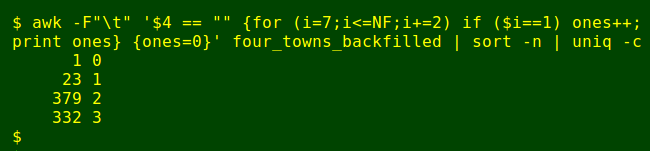
Curses! There's one date without a 1-day fall at any of the other stations. Which day is it?
awk -F"\t" '$4 == "" && $7 != 1 && $9 != 1 && $11 != 1' four_towns_backfilled
grep -C5 1994$'\t'11$'\t'28 four_towns_backfilled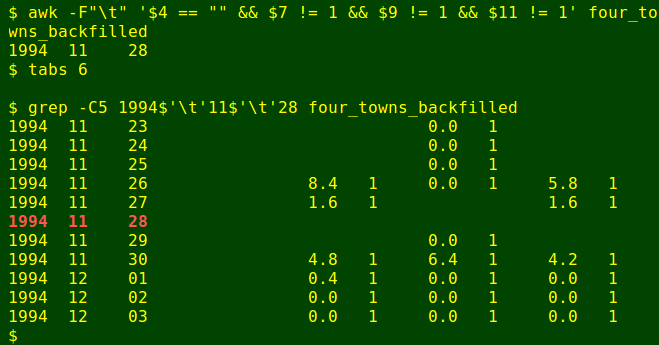
Fortunately, there's a nearby station with a rainfall total for 28 November 1994, according to the Bureau's online records. It's West Pine (15 km to the west) with a fall of 2.0 mm. I'll use that figure as-is:
awk -F"\t" 'BEGIN {FS=OFS="\t"} $1 == 1994 && $2 == 11 && $3 == 28 {$4 = "2.0"; $5 = "estIF"} 1' four_towns_backfilled > four_towns_backfilled_infill
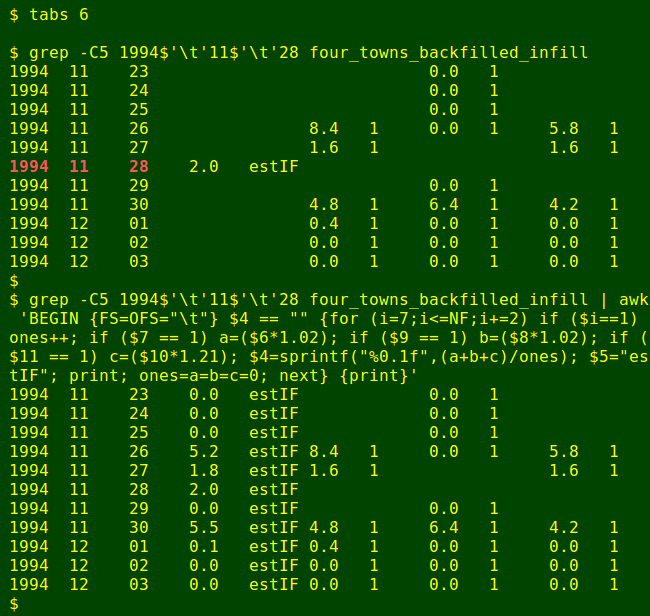
grep -C51994$'\t'11$'\t'28 four_towns_backfilled_infill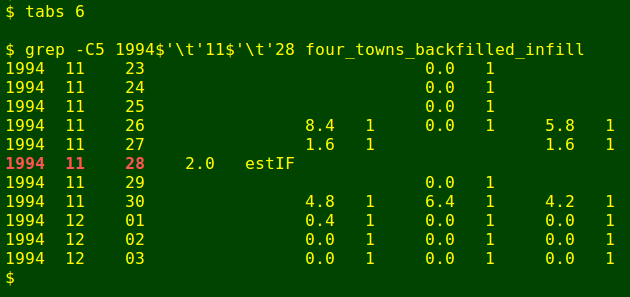
OK, I'm ready to average the available, adjusted 1-day nearby-station rainfalls and add them wherever Ulverstone is still missing a total. I use an exceptionally ugly modification of the command above that tallied 1-day falls, here spread over several lines for clarity:
awk 'BEGIN {FS=OFS="\t"} $4 == "" {for (i=7;i<=NF;i+=2) if ($i==1) ones++; \
if ($7 == 1) a=($6*1.02); if ($9 == 1) b=($8*1.02); if ($11 == 1) c=($10*1.21); \
$4=sprintf("%0.1f",(a+b+c)/ones); $5="estIF"; print; ones=a=b=c=0; next} \
{print}' four_towns_backfilled_infill > four_towns_backfilled_infilled
AWK here searches for lines with the Ulverstone total field (4) blank. When it finds such a line, it carries out the actions within the first set of curly braces, beginning with "for (1=7)" and ending with "next". That "next" makes AWK move to the next line and start again. If the next line has a non-blank Ulverstone total, the action in the next set of curly braces is carried out, namely "print" the line.
Back to the first set of actions. First, AWK counts up the number of 1-day totals available, as before, and stores the number in "ones". Next, it checks the Burnie, Latrobe and Northdown period fields (7, 9 and 11). If the period is 1, AWK stores the adjusted total (in fields 6, 8 or 10, multiplied by the appropriate adjustment factors) in a variable ("a" for Burnie, "b" for Latrobe, "c" for Northdown). AWK now replaces the blank field 4 with the average of the available, adjusted 1-day totals at the other stations, printing the average to the nearest 0.1 mm with sprintf. Field 5 (period) is then replaced with "estIF". Note that if "a", "b" or "c" doesn't exist because there was no 1-day total at that station on that date, then AWK treats the variable as zero in calculating the average. After printing the line, the four variables are all re-set to zero.
To demonstrate that this monster actually works, here's the command operating in the neighbourhood of 28 November 1994:
and here are some tallies:
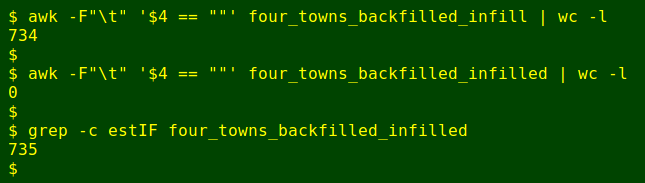
There were 734 dates with a blank Ulverstone total after 28 November 1994 was filled in, and none after the big infilling command was used. The total number of lines with infilled blanks and "estIF" in Ulverstone's period field is now 735.
A final step is to cut out the first five fields of four_towns_backfilled_infilled to make rain3:
cut -f1-5 four_towns_backfilled_infilled > rain3Ta da!
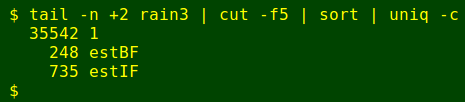
After a lot of tweaking I finally have what I wanted, a complete set of 100 years of daily rainfall totals for Ulverstone, ready for analysis as file rain3. (Analysis with AWK, of course...) The spread of data sources is shown below, where "1" is a 1-day total from the Bureau of Meteorology's record, "estBF" is a backfilled estimate and "estIF" is an infilled estimate:
tail -n +2 rain3 | cut -f5 | sort | uniq -c